How to Use the Option Heatmap

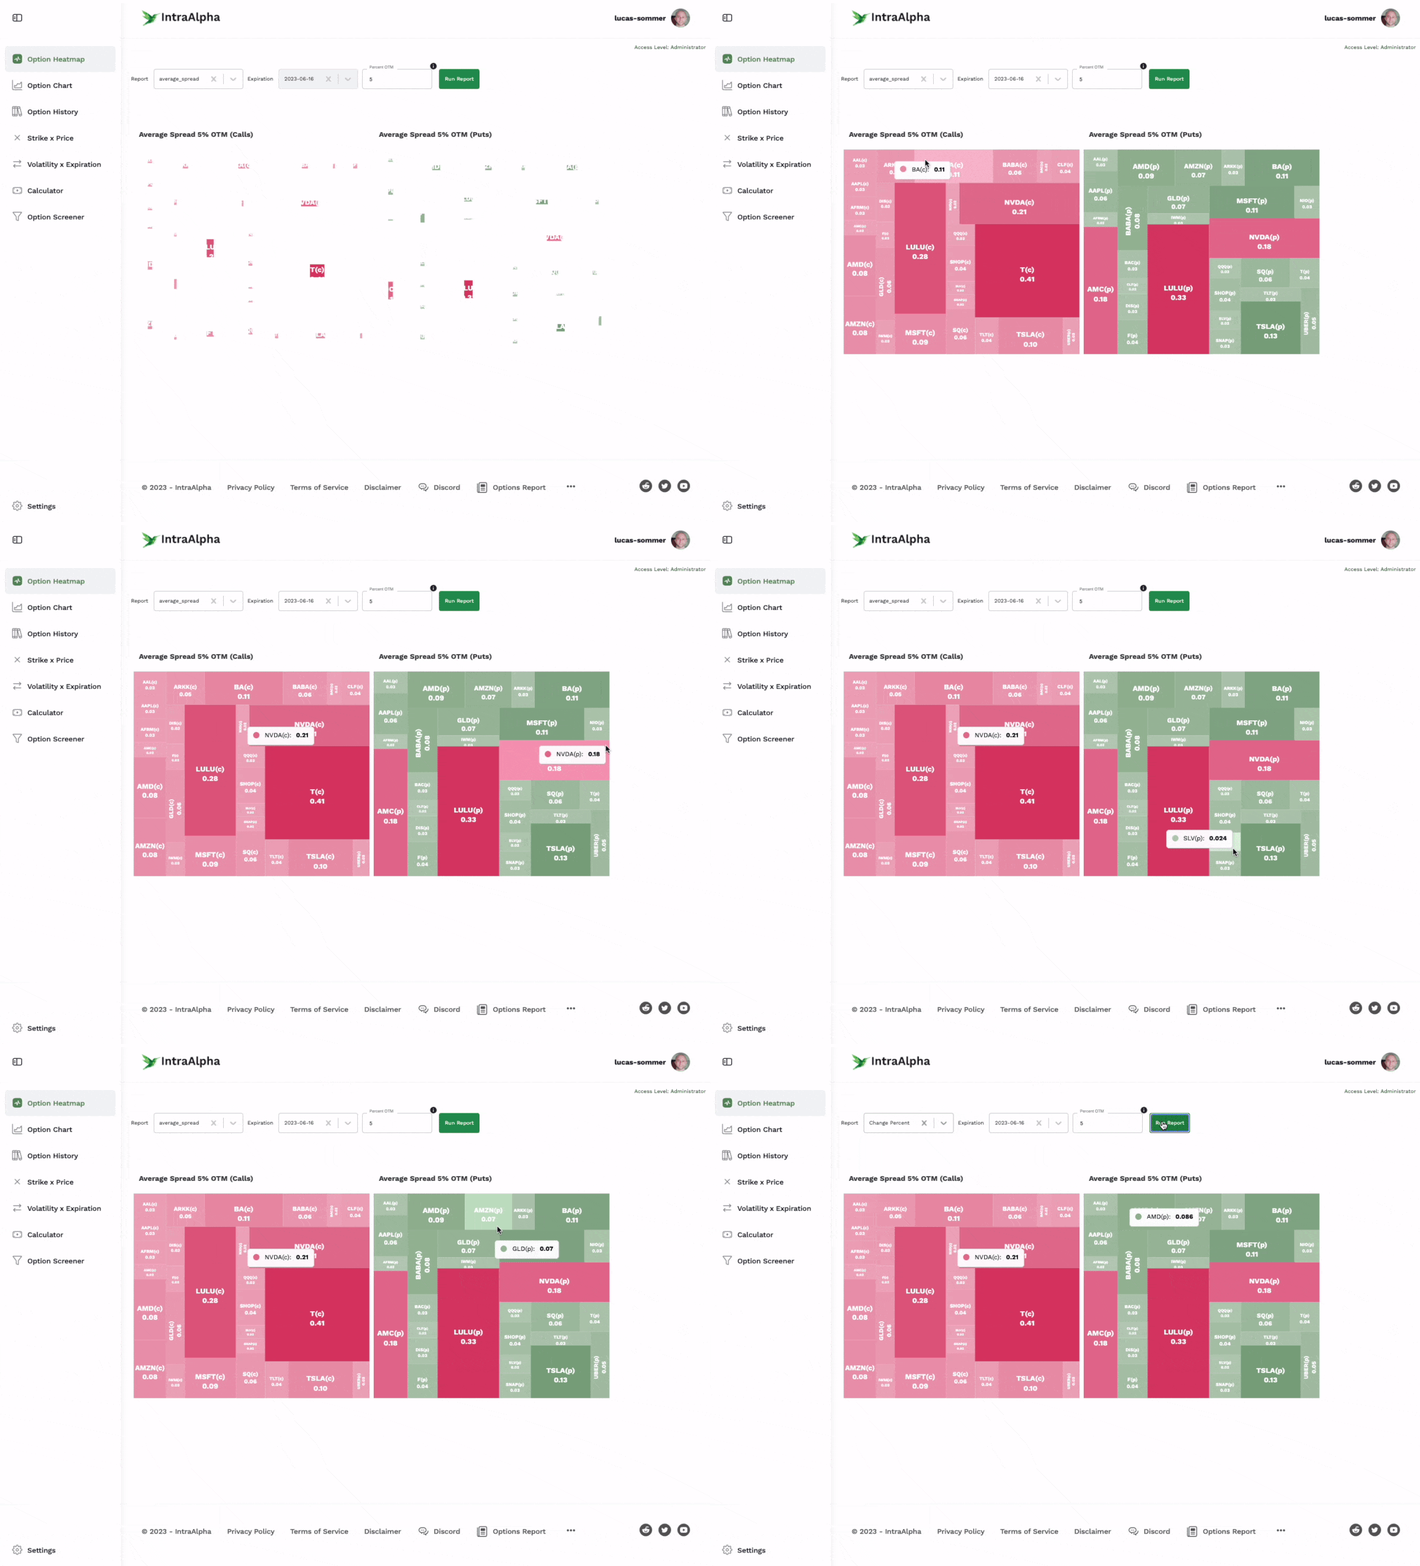
The Options Heatmap is a report designed to give options traders a new type of “watchlist” to help them find trading opportunities on the stocks they follow. Rather than looking at equity charts, the Option Heatmap provides 8 different methods for reviewing changes in the options market and finding trading opportunities.
All reports are evaluated based on your watchlist and analyze calls and puts with strike prices that are a percentage_awayfrom the current underlying price which expire on expiration_date.

- Average Spread: represents the average spread between the bid and the ask. The values represent the “slippage” and costs associated with transacting on these option contracts. Lower values are more efficient than higher values.
- Change Percent: represents the change in price, as a percentage, from the previous close price compared to option contracts current price.
- Open Interest: represents the current average Open Interest for the options on the watchlist.
- Volume: represents the current Volume traded today for the options on the watchlist.
- Delta: represents the delta values for options that are
percentage_awayfrom the underlying. - Implied Volatility: represents the average Implied Volatility.
- Last Trade: represents the average current price for the options on the watchlist.
- Change to Break Even: represents the change in the underlying price that is required for the option to break even.
Examples and Insights:
- Spreads are too Costly: Options with spreads that are too wide should likely be avoided because they are too costly to trade. A round trip trade on these contracts might cost much more than expected and traders should not always assume they will be filled, for the bid, the ask or the mid.
- Trade the Gap: Options that “gap” up or down substantially might present trading opportunities for options traders who want to fade the drastic change in price, or join the trade by following the trend.
- Follow the Volume: Look for big changes in Open Interest and Volume to track larger than average trades. Traders can use this information to follow large block trades which may represent “inside information” or trade blocks that are large enough to move the market.
- Sell or Buy the Move: Using Change to Break Even, traders can align the options they track to their own technical analysis of support and resistance. If the change to break even is overpriced or underpriced option traders can take the opposite side to buy or sell this move.
Next Steps
Only members can access this feature but a delayed or alternative version might be available on discord, reddit, twitter or e-mail. Have questions or need support? Join the discord server for the fastest response, or fill out our contact form to report something else.


